Since April, I have been keeping a basic set of beer drinking statistics. Not 100% coverage of all that I drank during the year, but a pretty good deep dive into what I have been pouring into my pint, tulip and other glassware.
Maybe it was seeing the numbers that started a self-fulfilling prophecy but pretty quickly the numbers in the (3) columns (ounces drunk, ABV and cost) collected to an average that did not deviate much.
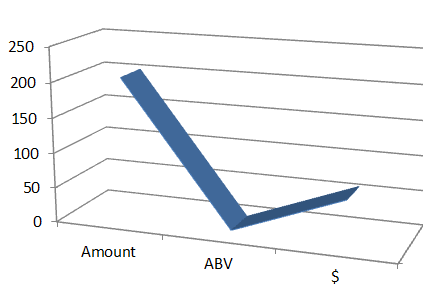
Within three weeks, the weekly amount drunk settled into a range between 204-208. The high week was 288 and the low 163. The average ABV was even more constricted into an under 1/2 percentage range from 6.51% to 6.99%. The high ABV week was 8.96% with the low clocking in at 5.19%. Dollars spent per week was where the widest gulf was found going from $49.90 to $62.86 from Week 5 to Week 29. The low week was $31.75 and the high was $136.00.
Overall the average amount consumed was 204.31 at an average ABV of 6.74% spending $60.95 a week to do so.
Also, in utilizing my Excel skills, I was able to rank the breweries that I most drank from. Yes, it includes samplers but this list is meant to analyze more who I reached for than just quantity.
Eagle Rock 25 They are my closest brewery. No shock here.
Stone 24 Usually bought at Trader Joe’s
Firestone Walker 24 A blog favorite plus, Luponic Distortion
Mumford 22 Obviously my DTLA pick
Sierra Nevada 18 Beer Camp and Oktoberfest
Highland Park 17 I would have thought this would be higher
El Segundo 15 Day 1 releases, ’nuff said
Lagunitas 13 Tour of Azusa plant basically
Brewyard 10 My Glendale brewery. Will be more next year
The Bruery 10 Kind of surprise, cost should have impacted
I will keep you updated on how 2017 shakes out. Already pumping data into the new spreadsheet.