2023 Statistics from my Beer Spreadsheet, yes, I am geeky like that.
This is all my beer drinking data. I haven’t posted as frequently about it as I have in the past because I post monthly about the best beers of each month.
But I do like to go through and cover some findings that jumped out to me….
- Average ounces per week is down to 143.84 a drop of over 11 ounces
- Average ABV was 7.21%
- Brewery with most Best of the Week Wins was Firestone Walker with 3, there were 5 breweries with 2 wins
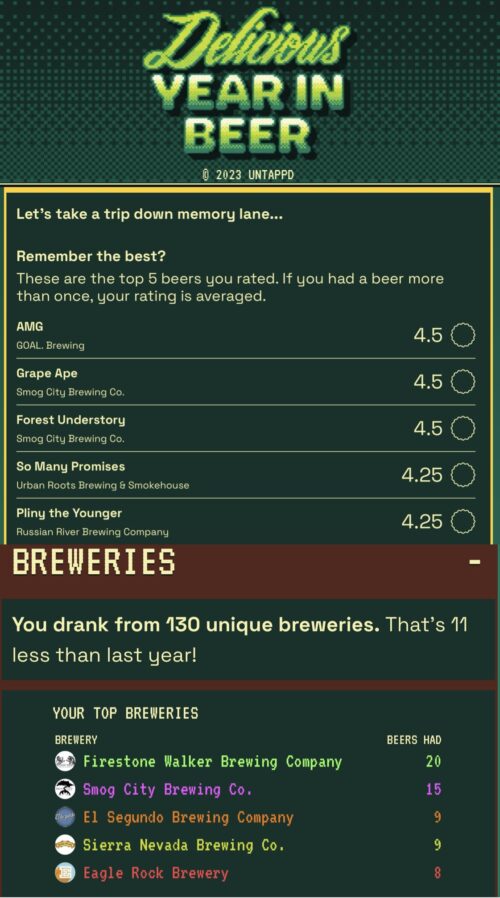
- Top 5 Breweries by Beers tasted are Firestone Walker with 43, Sierra Nevada with 32, El Segundo with 26 and Smog City with 24
- I visited 16 new (to me) breweries with 5 being in the Los Angeles area
- I tasted 17 new (to me) brewery beer with 3 being in L.A.
- Tasted 620 beers overall
- Only 3 in the popular 19.2oz format, one of which – Juice Force IPA from New Belgium was certainly in my bottom 5 beers
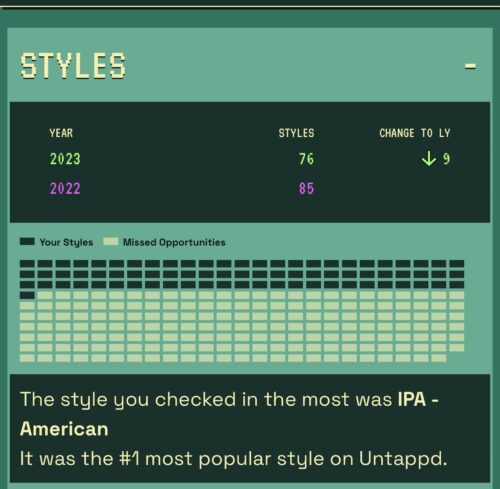
- IPAs were 296, Barrel-Aged 45, Pilsner/Lager 78 and Sour 14 (at least IPAs were under half)
- 520 of the beers were California brewed, 44 from my home state of Oregon, 38 from the other 48 states and 18 Foreign brewed.


