State Stats

The statistical arm of the Brewer’s Association put up a handy set of graphics for each state that gives a snapshot of brewing activity in the state.

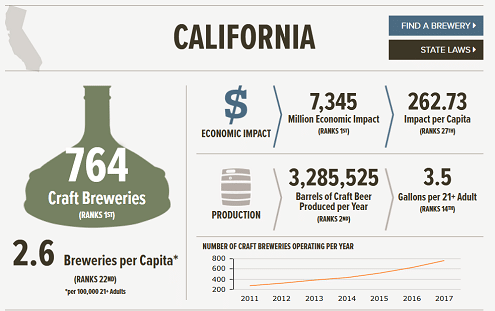
This time around, I want to point out the rankings that are in smaller print underneath the headline numbers. And what I want to specifically call to attention are the per Capita numbers. California has the most breweries in the Union but factoring in our large population we fall to middle of the pack at 22nd. Same with economic impact, we fall from 1st to 27th.

Those aren’t to be read as negative because, we may have a higher proportion of tiny breweries. And ranking higher in per Capita breweries might strain the infrastructure and lead to unhealthy amounts of competition.

The last important number is that economic impact. If that continues to grow, even if the other numbers do not, then the clout that our brewer’s guilds can wield will grow.

Drinking Stats – 2018 Q1

The drinking stats are back! I set a fairly ambitious goal for 2018. Bring my average ounces drunk, per week down to 175. In current terms that is a shade under 11 – 16oz cans of hazy IPA.

So far, I am doing well with the average ounces per week at 171.92. The high week in the first quarter was 200 and the low was 162.40. Most of the weeks have come in an ounce or two under that 175 target.

My other goal was to get the split between the Big 3 (IPA, Sour and Barrel-Aged) down to 50% compared to, literally, all other styles. Right now, I am off by nearly 4% which means that I need to be buying more lagers and saisons for starters.

Some other stats:
Average ABV – 6.62% with a high week of 7.23% avg. and low of 5.94%.
Average dollar spend is $41.57 with a high week of $64.02 and low of $22.99.

And my favorite beers so far are as follows:
Angel City Public House Saison
Burial Beer Co. Ceremonial Session IPA
Homage One Evening Guava Sour
Finback Cosmic Vibration Coconut IPA

Drinking Stats for 2016

Since April, I have been keeping a basic set of beer drinking statistics. Not 100% coverage of all that I drank during the year, but a pretty good deep dive into what I have been pouring into my pint, tulip and other glassware.

Maybe it was seeing the numbers that started a self-fulfilling prophecy but pretty quickly the numbers in the (3) columns (ounces drunk, ABV and cost) collected to an average that did not deviate much.

Within three weeks, the weekly amount drunk settled into a range between 204-208. The high week was 288 and the low 163. The average ABV was even more constricted into an under 1/2 percentage range from 6.51% to 6.99%. The high ABV week was 8.96% with the low clocking in at 5.19%. Dollars spent per week was where the widest gulf was found going from $49.90 to $62.86 from Week 5 to Week 29. The low week was $31.75 and the high was $136.00.

Overall the average amount consumed was 204.31 at an average ABV of 6.74% spending $60.95 a week to do so.

Also, in utilizing my Excel skills, I was able to rank the breweries that I most drank from. Yes, it includes samplers but this list is meant to analyze more who I reached for than just quantity.

Eagle Rock 25 They are my closest brewery. No shock here.
Stone 24 Usually bought at Trader Joe’s
Firestone Walker 24 A blog favorite plus, Luponic Distortion
Mumford 22 Obviously my DTLA pick
Sierra Nevada 18 Beer Camp and Oktoberfest
Highland Park 17 I would have thought this would be higher
El Segundo 15 Day 1 releases, ’nuff said
Lagunitas 13 Tour of Azusa plant basically
Brewyard 10 My Glendale brewery. Will be more next year
The Bruery 10 Kind of surprise, cost should have impacted

I will keep you updated on how 2017 shakes out. Already pumping data into the new spreadsheet.

The Beer is Sentient

Capture2
What am I talking about? The IntelligentX Brewing Company, in Britain which is a weird (even for beer) collaboration between two not-breweries, a machine learning startup Intelligent Layer and creative agency 10x.

In a world first, IntelligentX is creating beer using a combination of data science and Artificial Intelligence. So far it’s created Golden, Amber, Pale and Black variants — and it is using some cutting-edge technology to do so.

Basically, IntelligentX’s has a decision making algorithm with the boring name of ABI that customer feedback data from a Facebook Messenger program to spit out what should be brewed next. Typical British styles like Golden, Amber, Pale and Black have been done so far. They also have “wild-card” ingredients that can be added and as more beer is produced, supposedly, a clear picture is seen as to what should be brewed more.

What it doesn’t seem to take into account is popularity of style in a city or region, the weather forecast or weather there is a holiday or big football match going on. Those being three data points that could affect whether a person picks up a pint or not. And that leads to the other missing data, those people who DON’T order your beer.

Will it succeed in London? The beers are available and there are brewery tours and events on their schedule.

Statistics and damn lies

So the first five weeks of tracking my beer intake and spending are in the books and one immediate take-away is that is has affected my drinking a bit. I set a weekly max. In this case, 240 ounces over 5 days. Sort of like a salary cap in the NBA. I could go over it without consequence but I wanted some sort of demarcation point.

In the first two weeks, I was butting up against that max number which led me to pull back the remaining three to the point where I was trying to comfortably land below that threshold.

Here are my numbers:
The low week was 176 ounces and the high week was 236.
Averaging out to 208.6 ounces per 5 day period.
Or drilling down to 40.84 ounces per day.
The biggest day was about 60 when I visited the Azusa location for next year’s opening Lagunitas Brewery. The combination of free plus riding Metro plus a long period of time led to that total.
Saturday and Sunday (obviously) were the big drinking days accounting for 49% of what was drunk each week.
Saturday was the biggest day on average with 56.8 ounces per day.

If I needed to cut down to a lower figure, Saturday would be where I started. Losing one regular sized beer from that day would be a start but getting that average below 50 would probably be better.

After the next five weeks, I will update the averages and let you know what transpired.