Let’s break this into (2) parts….
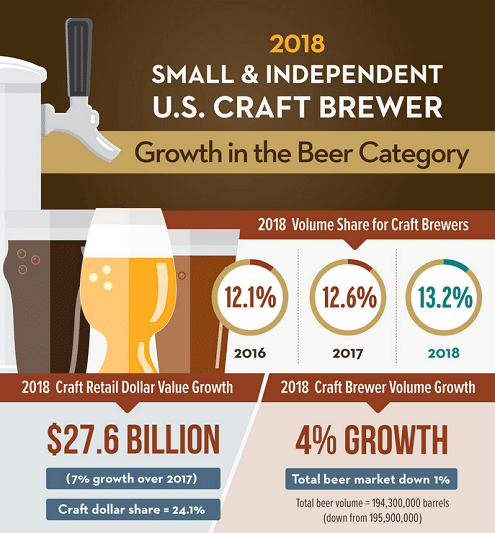
The two numbers that most people are going to obsess over are the big 4% and the 7% (Slightly more hidden) but since Bart Watson and the Brewers Association put a number at the top of the graphic, I wanted to focus on the .1 2016 to 2017 was .5% share of the market and 2017 to 2018 was .6% If you are looking for a silver lining then that is the big one. In a down market for beer overall, craft is still picking up share of mind.
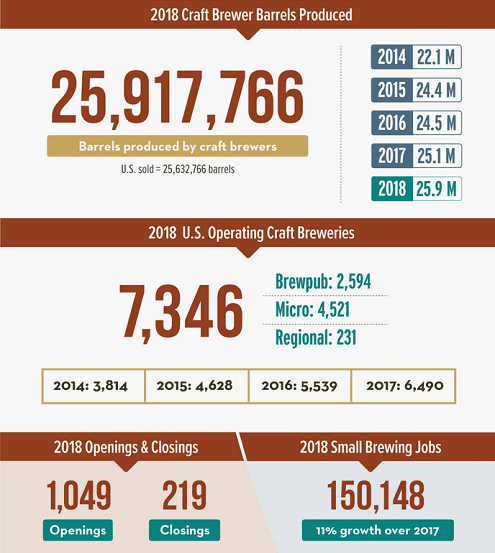
The number that I find most important are the opens vs closes in this section of the graphic. We need to follow this number and see when column A dips below 1K and when Column B goes up and over the 500 mark. I won’t guess at what is the perfect number of breweries for the US but if pressed, I would say around 7K seems good with some churn still going on.