The 2019 Statistical Breakdown

Time to gaze back at the drinking stats that I kept for 2019. Starting with the big picture and then drilling down a little bit.

2019 saw an average weekly consumption of 159.95 ounces or 31.99 ounces per drinking day. I do not have alcohol two days out of every week. This was a 7.86 ounce drop in consumption from 2018 and 44.36 less then when I first started in 2016.On average the ABV for the year was 6.74% and I spent around $45.32 per week on beer.

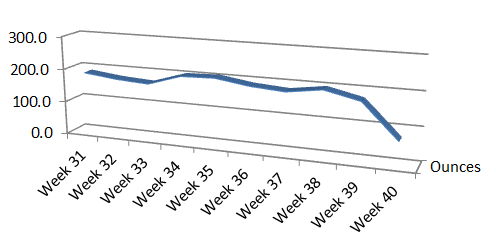
Over the year the high week of ounces was 247 and the low was 124. Highest ABV week was 8.33% and lowest 5.37%.

There were 738 beers on the spreadsheet with 358 being IPA (48.5%), there were 58 Barrel-Aged or Sours (7.9% which is too low and needs to be rectified in 2020) as well as 36 collaboration beers.

These beers were distributed geographically as 57 from Los Angeles breweries, 70 from California, 17 were foreign, 23 from Oregon (my home state so I track it separately) and 25 from the other 48 states.

Most popular breweries begin and end with Firestone Walker which had the most check-ins at 53 and ounces at 584. Other repeated favorites were Sierra Nevada, Eagle Rock Brewery, El Segundo Brewing, Angel City Brewery, Stone, Smog City Brewing and Beachwood. All of which are old-school not the hippest breweries around.

Overall, I was 3oz on average below my target goal. A goal that I am keeping steady for the next year. I really felt it when I overdid it and that is because I think my body had re-calibrated to the lower amount. Trying to dive lower might result in even more headaches. Also the easier way to reduce at this point would be to remove another drinking day from the week.

Now onto 2020!

Beer Stats – 2018 midpoint

Well, past the half-year marker actually but still a good point to evaluate what has been drunk this year. To recap, each year I am reducing the amount of beer for both health reasons and to push me to more fully enjoy the beer I do drink.

Let’s do the numbers….
The goal of 175 ounces per week is being met and then some. As of week 29, I am averaging 169.93 ounces per week or 10.62 pints. Since I take two drinking days off a week, it basically boils down to 2 pints a night (or full day for Saturday and Sunday). Right now the average ABV is 6.58% which is 0.01 from the average for 2017. This is the least volatile stat for me even though I am not an ABV watcher in the least.

46.4% of the beers drunk in 2018 fall outside of the IPA, Sour and Barrel-Aged category. So far, Eagle Rock, Sierra Nevada, Smog City and Angel City are in the lead for brewery ticking with favorite beers coming from Smog City – Awkward Teenager and El Segundo’s Hat’s Off IPA plus anything from Finback. I have had beers from 154 different breweries which puts me in the running to have beers from different brewers each day of the year.

One more update to come for Q3 before the full 2018 recap.

Stats Update


A quick update to my tracking efforts before the End of the Year rundown.

In Week 33, I had the lowest total (by ounces) drunk for the year with 169.4 for the five drinking days of the week. This plus a few days spent with muscle relaxants instead of beer have finally gotten me a shade below my target average for the year of 190 ounce per week. That will probably rise with a planned trip to Portland and Bend coming soon.

Due to the climate change warm weather here in L.A. the ABV is for all intents and purposes locked into a .04 range between 6.41% to and 6.45%. Making the high water mark of 6.94% earlier in the year seem like a super anomaly. Though I did receive a 2017 Black Tuesday in the mail, which could cause a minor disruption.

With only one quarter left in 2017, we will see if anything changes drastically.